A lower purchase price is straightforward to compare. Running cost takes a little more work, especially when two quotations include different motors, drives or service arrangements. For an RO or SWRO pump, we suggest starting with the same duty points and then comparing the complete supply over the same operating period.
Rohre supplies high-pressure pumps for fresh and clean water RO applications (HPH Series) and seawater RO applications (HPS Series). For either service, the cost comparison starts with alternatives selected for the same water and duty. Our SWRO pump selection guide covers the broader selection; this article focuses on calculating electricity and service costs.
Start with the flow through the high-pressure pump
If your plant specification gives product-water capacity, please also send the process flow diagram or mass balance. We need the flow in the high-pressure pump circuit to select the pump. Recovery ratio, recirculation, the energy recovery device (ERD), booster arrangement and pressure losses all affect that duty.
| Input | How to define it |
|---|---|
| Flow | Required high-pressure pump flow at each operating point, separately from plant product-water capacity. |
| Pressure | Pump discharge and inlet pressure under flow; identify membrane and pipe losses. |
| Water and site | Feed salinity, temperature, inlet conditions and applicable material requirements. |
| Operating profile | Hours at each duty, seasonal changes, starts, standby operation and cleaning modes. |
| ERD and auxiliaries | Circuit configuration, booster duties and which electrical loads are included. |
| Acceptance boundary | Delivered flow, pressure tolerance, measured input power and measurement location. |
Include seasonal and part-load operation if they matter to your plant. Two pumps can look similar at one operating point while their annual electricity use differs because they spend different amounts of time at other duties.
Read the curve with its pressure and speed
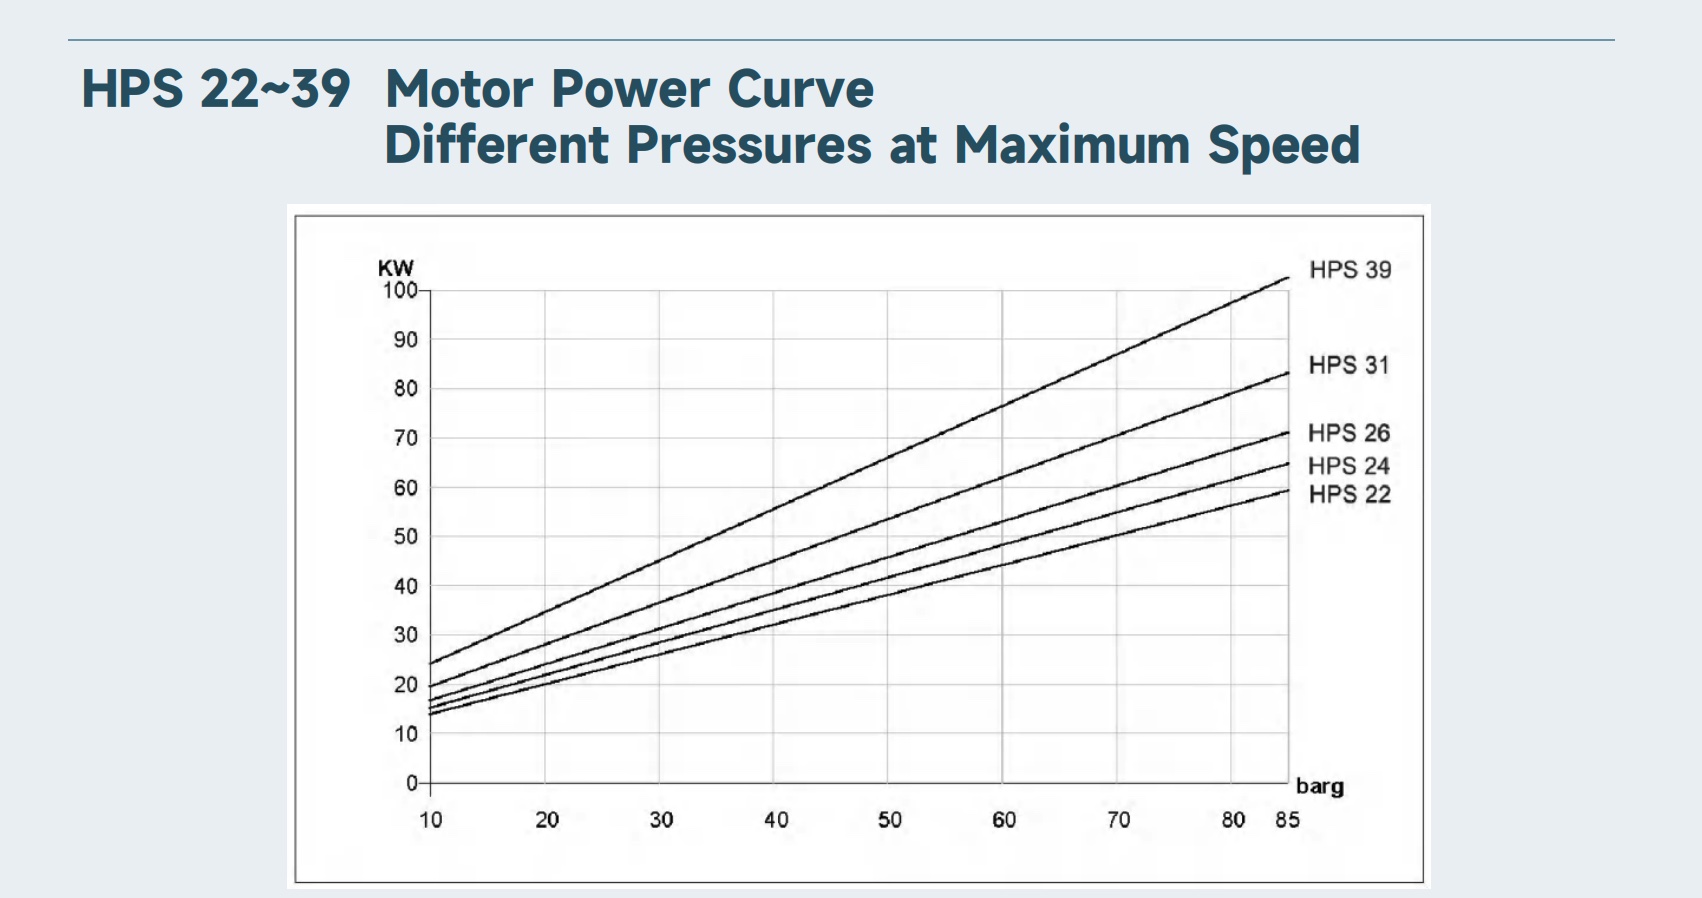
The HPS catalogue includes flow curves, power curves and installation dimensions. When reviewing a power figure, establish whether it is pump shaft demand, recommended motor size or electrical input. If your operating speed differs from the chart, ask us for the data relevant to your duty.
For a pressure-dominated, steady liquid duty, hydraulic power Ph (kW) ≈ Δp (bar) × Q (m³/h) ÷ 36, where Δp is pump outlet pressure minus inlet pressure on the same pressure basis, and Q is the actual flow through the pump. The unit conversion is 100,000 Pa/bar ÷ 3,600 s/h ÷ 1,000 W/kW = 1/36. With flow in L/min, the equivalent divisor is 600.
This pressure-only form assumes changes in velocity and elevation between the pump inlet and outlet are negligible. Where they matter, use Ph = ρgQH/1,000, with density ρ in kg/m³, Q in m³/s and pump total head H in meters. Correct remote pressure measurements to the pump flanges. These relationships follow the Hydraulic Institute formula reference, pages 4–6. In the pressure-based form, do not add another specific-gravity multiplier.
At a 60 bar pressure rise and 10 m³/h, the simplified calculation gives 16.67 kW of hydraulic power. If the outlet is 60 barg and the inlet is 3 barg, however, the pressure rise is 57 bar. This distinction affects the calculated power.
Electrical input Pin = Ph ÷ ηoverall. Use efficiency as a decimal, such as 0.80. Overall wire-to-water efficiency includes the pump, motor and drive losses within the selected measurement boundary, plus any intervening transmission losses. Pump efficiency or volumetric efficiency alone cannot replace it. Separate auxiliary loads must be added when comparing a complete package. The ERD arrangement determines the actual pump duty and the additional loads included in a plant comparison.
Put the electricity calculation on one page
Energy charge = electrical input (kW) × operating time (h) × tariff (currency/kWh). For varying duties or time-of-use tariffs, sum Pin,i × hi × ci for the separate periods. Add applicable demand charges and other tariff items separately; the example below compares the kWh energy charge only. The DOE/HI sourcebook, printed pages 58–61, explains electricity-cost estimates using operating hours and input power.
The example below uses two assumed efficiencies to show how the comparison works. Neither value is a measured HPS specification; replace them with verified data for the two offered configurations.
| Item | Option A | Option B |
|---|---|---|
| Differential pressure / flow | 60 bar / 10 m³/h | 60 bar / 10 m³/h |
| Assumed overall wire-to-water efficiency | 80% | 85% |
| Calculated electrical input | 20.83 kW | 19.61 kW |
| Annual hours at this duty | 8,000 h | 8,000 h |
| Calculated annual energy | 166,667 kWh | 156,863 kWh |
| Assumed electricity price | US$0.12/kWh | US$0.12/kWh |
| Calculated annual electricity cost | US$20,000 | US$18,824 |
With these assumptions, the annual difference is about 9,804 kWh, or US$1,176 at the stated electricity price. The figures are rounded. This is a useful way to test how sensitive your purchase decision is to efficiency, operating hours and electricity cost.
For a variable operating profile, calculate each period separately and add the results: annual kWh = Σ(input kW at duty i × hours at duty i). This is more representative than applying the maximum load to every operating hour.
If you are comparing system specific energy consumption in kWh/m³, include the same electrical loads for both options and divide by product-water volume over the same period. This keeps the pump comparison consistent with the plant-level calculation.
Decide whether the electricity saving pays for the higher purchase price
Simple payback (years) = additional initial cost ÷ annual net operating-cost saving, provided the annual saving is positive and reasonably constant. This is an undiscounted screening calculation. For variable annual savings, follow the cumulative cash flow; for a full investment comparison, include the timing of costs and benefits. The method and its limits are described in the DOE/HI sourcebook, printed page 65.
Continue the example by assuming Option B costs US$3,000 more to purchase and integrate. With both options meeting the same duty, the electricity-only simple payback is the extra initial cost divided by the annual electricity saving. The table keeps the assumed US$0.12/kWh tariff and 80% versus 85% overall efficiencies.
| Hours per year at the example duty | Annual electricity saving | Simple payback on US$3,000 | Five-year saving after the price premium |
|---|---|---|---|
| 8,000 h | US$1,176 | 2.6 years | US$2,882 |
| 4,000 h | US$588 | 5.1 years | −US$59 |
| 2,000 h | US$294 | 10.2 years | −US$1,529 |
Figures use the unrounded power calculation and are rounded for display. These illustrative results include electricity and the assumed price premium only; service differences, financing and residual value are excluded.
At 8,000 hours a year, the energy saving recovers the premium within a five-year ownership period. At 2,000 hours, electricity alone does not justify that premium over five years. For the same assumptions, the break-even use is approximately 4,080 hours per year over five years. This is why a continuously operating desalination plant and an intermittently used unit can reach different purchasing decisions.
The next step is to add the service-cost difference. If Option B costs more to maintain, subtract that extra annual cost from its electricity saving before calculating payback. If the resulting net annual saving is zero or negative, there is no operating-cost payback under those assumptions. Availability, installation fit or delivery may still justify the choice, but they should be evaluated separately.
Discuss the service items behind the quotation
Service cost becomes useful when it is tied to an actual task and interval. For each offered model, we can review the specified inspection work, applicable seal or wear-part replacement, parts cost, labor and access time. Count the interventions expected during the chosen ownership period, then include filter consumables and any planned spare assembly. A service interval expressed in running hours produces a different annual budget for a continuously operating plant than for an intermittently used unit.
Keep planned maintenance and unplanned downtime separate. For downtime, use your site’s production loss after allowing for standby capacity and stored water; a pump being unavailable does not necessarily mean the entire plant stops producing. Where the frequency is uncertain, compare a base case and a higher-cost scenario instead of presenting an assumed failure rate as a measured result.
| Cost item | Items included in the comparison |
|---|---|
| Purchase and integration | Pump, motor, drive, adapters, base, shipping and installation scope. |
| Routine service | Model-specific inspection and service instructions; expected parts, labour and access requirements. |
| Filtration and inlet support | Consumables and auxiliary energy required by the actual inlet arrangement. |
| Wear parts and spares | Part numbers, current quotations, availability and the proposed stock of critical spares. |
| Downtime | Expected service time, site access, standby capacity and the buyer’s cost assumptions. |
| Replacement and end of period | Replacement scope, planned review period and any residual-value assumption. |
Water quality, inlet supply and the operating cycle influence the service plan. The installation and maintenance guide provides general operating guidance; the selected model determines the applicable service requirements. Keep quoted parts and labour costs separate from estimates of service frequency or downtime, so you can see which assumptions change the purchasing decision.
Use the same currency and comparison period for both options. If your purchasing model includes financing or discounting, apply the same method to each.
Use a project case to understand the system arrangement
Our 500 m³/day island SWRO case describes two 250 m³/day containerized trains, an HPS 11 replacement and an energy recovery arrangement. It gives useful context for reviewing a similar installation.
The case reports approximately 3 kWh/m³ of product water for the system. That figure links energy use to saleable output and is useful when considering a similar plant arrangement. It includes the effect of the system configuration and energy recovery, so it should be compared with a matching system-level energy boundary rather than with pump shaft power alone. For your plant, the flow diagram, operating profile and electrical measurement points establish that comparison.
Calculation references and example inputs
- Hydraulic Institute — Pump System Certification Exam: Formula Reference Sheet, pages 4–6: total head, hydraulic output, shaft input and overall efficiency. The ÷36 and ÷600 forms above are unit conversions of the pressure-power relationship.
- U.S. Department of Energy and Hydraulic Institute — Improving Pumping System Performance: A Sourcebook for Industry, Second Edition, May 2006. Printed pages 58–61 cover electricity costs; printed page 65 covers simple payback and its limitations. In the PDF viewer these are pages 62–65 and 69, respectively.
The 60 bar duty, 10 m³/h flow, 80% and 85% overall efficiencies, US$0.12/kWh tariff, US$3,000 price difference and operating-hour scenarios are assumed teaching inputs. They are not measured Rohre-versus-Danfoss results or efficiency values taken from these references. The references support the calculation method; a project comparison uses its own performance data, quotations and tariff.
The five-year break-even figure is calculated as annual hours = 3,000 ÷ [5 × (20.833333 − 19.607843) × 0.12] ≈ 4,080 h/year. It assumes unchanged duties, efficiencies and tariff, equal service costs and no discounting.
Send us the duty and the operating profile
Please include the process flow diagram, required pump duties, annual operating hours and ERD arrangement. We can review the pump and motor configuration for your water service and compare the relevant running costs.
Explore RO and seawater high-pressure pumps · Send your pump duty · Discuss your comparison with Rohre